Data Products and Downloads: DNA10-S
S-velocity model for the western US integrating body- and surface-wave constraints
DOWNLOAD THE MODEL
View the model in the IRIS EMC :
DAN10-S
If used please cite:
Obrebski, M., R.M. Allen, F. Pollitz, S.-H. Hung. Lithosphere-Asthenosphere Interaction Beneath The Western US From the Joint Inversion of Body-wave Travel Times and Surface-waves Phase Velocities Geophys. J. Int. 185 1003-1021, doi: 10.1111/j.1365-246X.2011.04990.x, 2011. View reprint
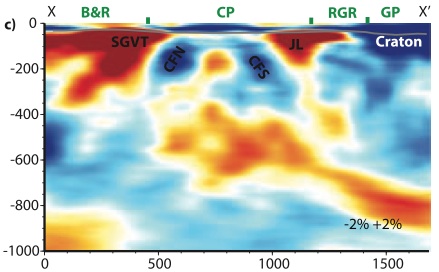
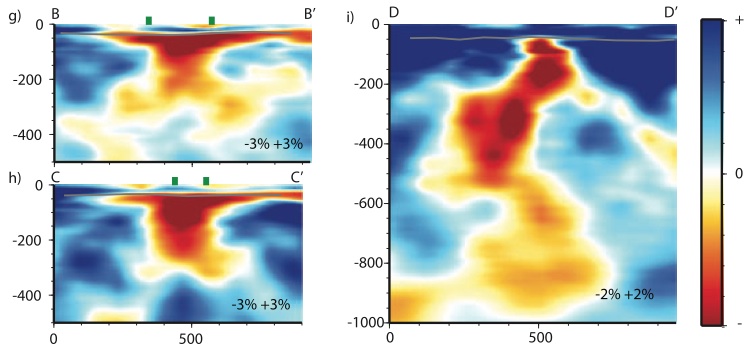
NW-SE cross-section across the Colorado Plateau showing the two lithospheric drips. See Fig 13 Obrebski et al 2011
Model highlights:
The DNA10-S model integrates teleseismic body-wave traveltime and surface-wave phase velocity measurements into a single inversion to constrain the S-wave velocity structure beneath the western US (from the Pacific coast to ~100 deg W, from Mexico to Canada). By combining these datasets we can constrain both the lithospheric structure, with a horizontal resolution of ~100km and vertical resolution of ~10 km, and the mantle structure to 1000km depth with a resolution of ~250 km. This allows imaging of the process of mantle convection and its interaction with the lithosphere. The stable and old Colorado Plateau is imaged with two high-velocity and cylindrical anomalies extending into the mantle below. These are interpreted as lithospheric drips and can explain the Cenozoic uplift of the plateau. The low-velocity S-shaped plume conduit beneath Yellowstone extends from the lower mantle up to the active caldera and then spreads out beneath the Snake River Plain. For the first time we can image the parabola shape of the residual plume material that is aligned exactly with the surface tectonic parabola. Subduction has been ongoing beneath the Pacific Northwest for more than 150Ma. Today's high-velocity slab is imaged in the mantle, along with a series of similar features to the east of the current slab. These are interpreted as fossil slab fragments of the Farallon plate. The complex S-shape of the Yellowstone plume is a result of the plume weaving a path to the surface between these slab fragments.
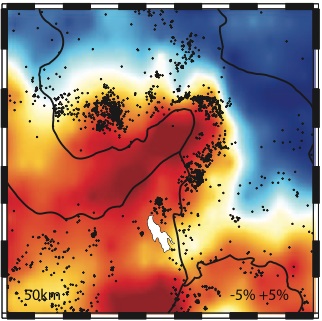
Section through the plume pancake at 50km depth showing the low-velocity plume material spreading out beneath the lithosphere. See Fig 12. Obrebski et al 2011
Vertical sections orientated perpendicular to the hotspot track. Beneath Yellowstone the plume conduit is observed. Below the Snake River Plain the shallowing and broadening plume head can be seen. See Fig 12. Obrebski et al 2011
Model specifications:
- Parameters: DNA10-S is an S-velocity model
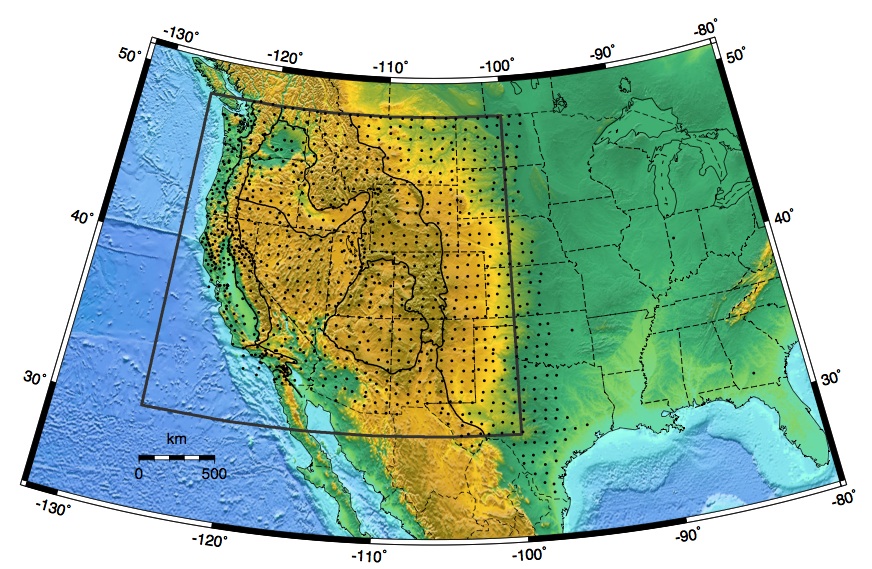
- Coverage: Good resolution extends from the Pacific coast to the Great Plains (~100 deg W), from the Mexican border (31 deg N) to the Canadian border (49 deg N).
- Data source: More than 1200 stations where used from the USArray transportable array, regional seismic networks, and temporary seismic deployments.
- Data type: Relative traveltimes of teleseismic body waves (S and SKS) from about 162 earthquakes, and surface wave phase velocity measurements from 167 eartqhuakes were used to constrain the model.
- Inversion: Finite frequency sensitivity kernels and phase velocity sensitivity kernels are used in a damped (but not smoothed) LSQR inversion.
- Resolution: The model can resolve mantle structure to a depth of ~1000 km and with a lateral and vertical resolution of ~250km. In the upper ~200km where the surface waves provide additional constraints the lateral resolution is ~100km and the vertical resolution is ~10km.
Publication
Obrebski, M., R.M. Allen, F. Pollitz, S.-H. Hung, 2011. Lithosphere-Asthenosphere Interaction Beneath The Western US From the Joint Inversion of Body-wave Travel Times and Surface-waves Phase Velocities Geophys. J. Int. 185 1003-1021, doi: 10.1111/j.1365-246X.2011.04990.x View reprint