Data Products and Downloads: PNW10-S
S-velocity model of the Cascadia Subduction Zone using Ambient Seismic Noise Tomography
DOWNLOAD THE MODEL (tar file)
View the model in the IRIS EMC:PNW10-S
If used please cite:
Porritt, R. W., Allen, R. M, Boyarko, D. C., and Brudzinski, M. R., Investigation of Cascadia Segmentation with Ambient Noise Tomography. Earth and Planet. Sci. Lett., 309, 67-76. doi: 10.1016/j.epsl.2011.06.026, 2011.
reprint
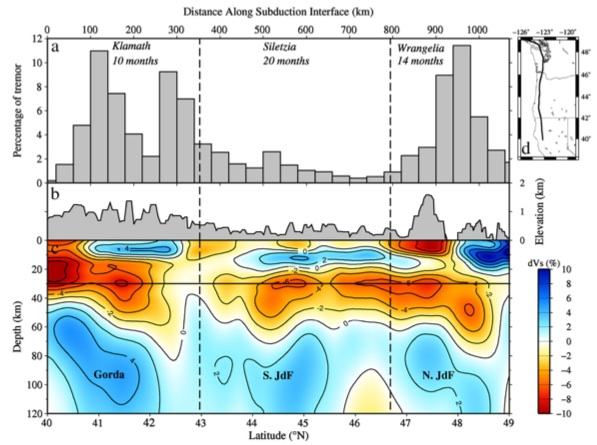
N-S cross-section throught the Cascadia forearc. See Fig 7 Porritt et al 2011
Model highlights:
PNW10-S is an ambient noise tomography 3D velocity model, but uses analyst selection to ensure the highest quality data as input to the model inversion. Incorporating spatially and temporally long paths with this manual selection step allows recoverable structure from the surface to ~120km depth. This model focuses on the US Pacific Northwest to address a series of questions relating to variations in arc volcanism, seismicity, tremor activity, and the relation to subduction-complex structure. In this model we image lateral discontinuities of the subducting slabs in line with offshore transform faults in the Juan de Fuca plate. This suggests zones of weakness in the subducting plate creating pathways for upwelling material through the plate. This observation along the continuation of the Blanco transform fault explains the high heat production observed in the southern Cascades as arising from an upper mantle source. Variations within the crustal structure align with long term tremor segmentation boundaries suggesting the structure of the overriding plate has an effect on tremor frequency.
Model specifications:
- Parameters: PNW10-S is a Vsv model derived from fundamental mode Rayleigh waves on ambient seismic noise cross correlations
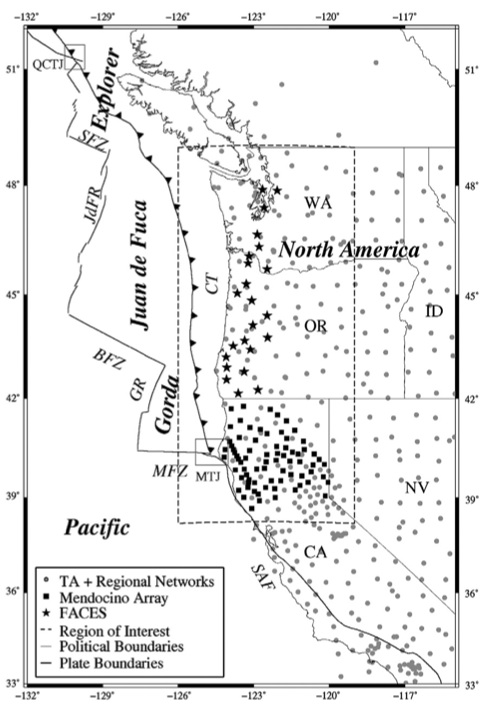
- Coverage: Cross correlations span the entire US, with a handful of stations in Canada and Mexico. The inversion solves for relative structure from 33N to 49.5N latitude and 126W to 110W longitude, but we extract the well resolved section from 38.2N to 49N and 126W to 119W due to its data density.
- Data source: While our dataset focuses on two Flexible Array Experiment (FACES and Mendocino) more than 1200 stations where used from the USArray transportable array, regional seismic networks, and temporary seismic deployments.
- Data type: Phase velocities measured from inter-station paths with a Frequency-Time Analysis procedure to prepare period dependent maps.
- Inversion: Phase velocities are converted to perturbations to the 1D WUS model of Pollitz, 2009 with a crustal thickness determined by prior receiver function analysis (Audet et al., 2010, Levander et al., 2007). The relative phase velocities are then inverted with damped LSQR.
- Resolution: Horizontal resolution varies with spatial coverage and can perhpas be best estimated around the minimum station spacing of ~50km. Vertical resolution varies with depth as the shallower regions are more densely sampled and can thus be considered better resolved, but we estimate an overall vertical resolution of ~10km. See the published manuscript for more detailed resolution analysis.
Publication
Porritt, R. W., Allen, R. M, Boyarko, D. C., and Brudzinski, M. R., Investigation of Cascadia Segmentation with Ambient Noise Tomography. Earth and Planet. Sci. Lett., 309, 67-76. doi: 10.1016/j.epsl.2011.06.026, 2011. View reprint.