Data Products and Downloads
Derived data products generated by group members are generally made available as the work is published. Below is a list of data products available. Reasonable suggestions and requests for additional products are welcome. Many of the 3D velocity models are also avilable through the IRIS Earth Model Collaboration which provides simple web-based tools to slice and view the models.
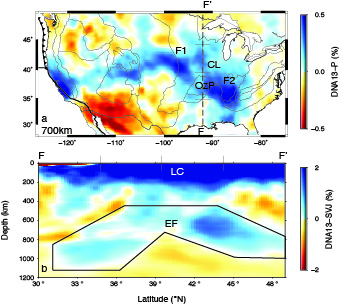
DNA13-P, -SV, -SH, SVjoint
P- and S-velocity models for the US integrating body- and surface-wave constraints
Data downloads
Publication
The DNA13 model contains four estimates of the relative seismic wave-speed (1 P and 3 S) for the US upper mantle from the west coast to the Great Plains.
The P, SH, and SV components utilize finite-frequency kernels and relative first arrival times for a set of body-wave only models.
The SV-Joint component utilizes the SV component relative arrival times, teleseismically determined phase velocities, and ambient noise derived phase velocities in a single inversion.
Imaged structures include variousions in lithospheric thickness, fossil slabs, active slabs and the upwelling Yellowstone plume.
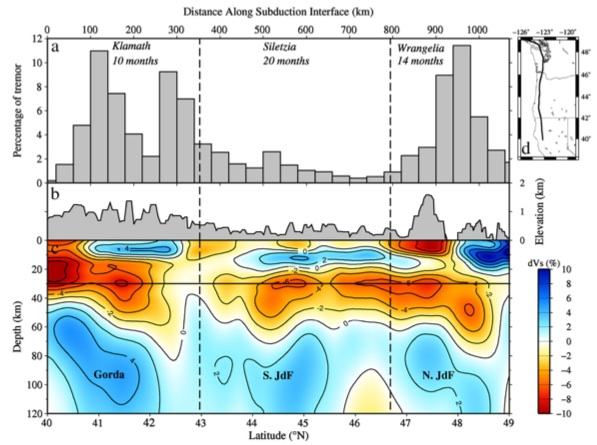
PNW10-S:
S-velocity model of the Cascadia Subduction Zone using Ambient Seismic Noise Tomography
Data downloads
Publication
PNW10-S is an ambient noise tomography 3D velocity model, but uses analyst selection to ensure the highest quality data as input to the model inversion. Incorporating spatially and temporally long paths with this manual selection step allows recoverable structure from the surface to ~120km depth. This model focuses on the US Pacific Northwest to address a series of questions relating to variations in arc volcanism, seismicity, tremor activity, and the relation to subduction-complex structure.
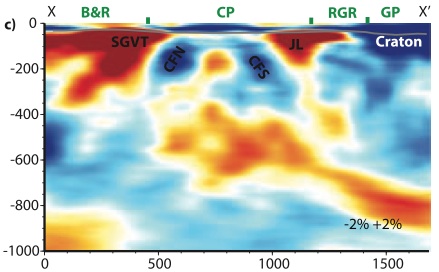
DNA10-S:
S-velocity model for the western US integrating body- and surface-wave constraints
Data downloads
Publication
The DNA10-S model integrates teleseismic body-wave traveltime and surface-wave phase velocity measurements into a single inversion to constrain the S-wave velocity structure beneath the western US (from the Pacific coast to ~100 deg W, from Mexico to Canada). By combining these datasets we can constrain both the lithospheric structure, with a horizontal resolution of ~100km and vertical resolution of ~10 km, and the mantle structure to 1000km depth with a resolution of ~250 km. This allows imaging of the process of mantle convection and its interaction with the lithosphere.
Shear-wave splitting observations:
From the FACES and Mendocino Earthscope Fexible Array experiments in Cascadia
Data downloads
Publication
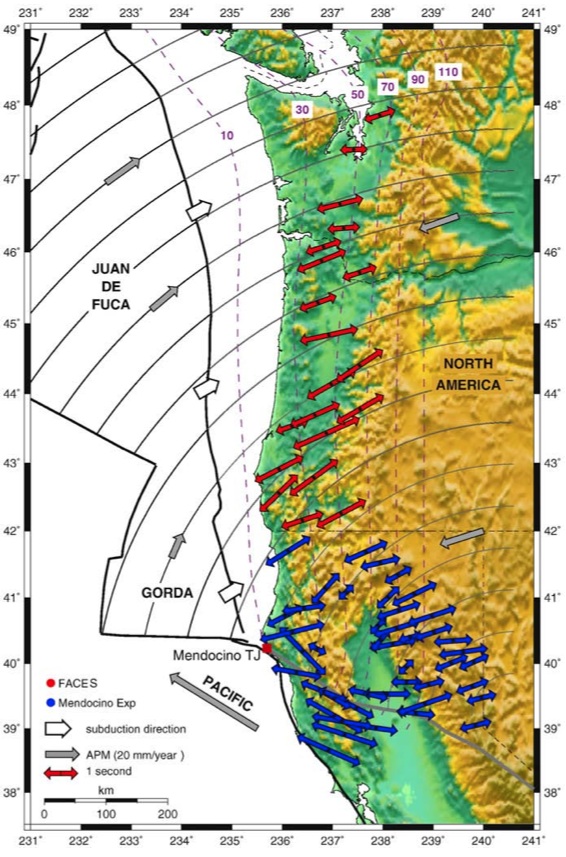
The FACES and Mendocino experiments were deployed along the Cascadia subduction margin. The stacked shear-wave splitting observations made in Eakin et al., 2010 are made available here.
DNA09-P&S:
Finite-frequency P- and S-velocity models for the western US
Data downloads
Publication
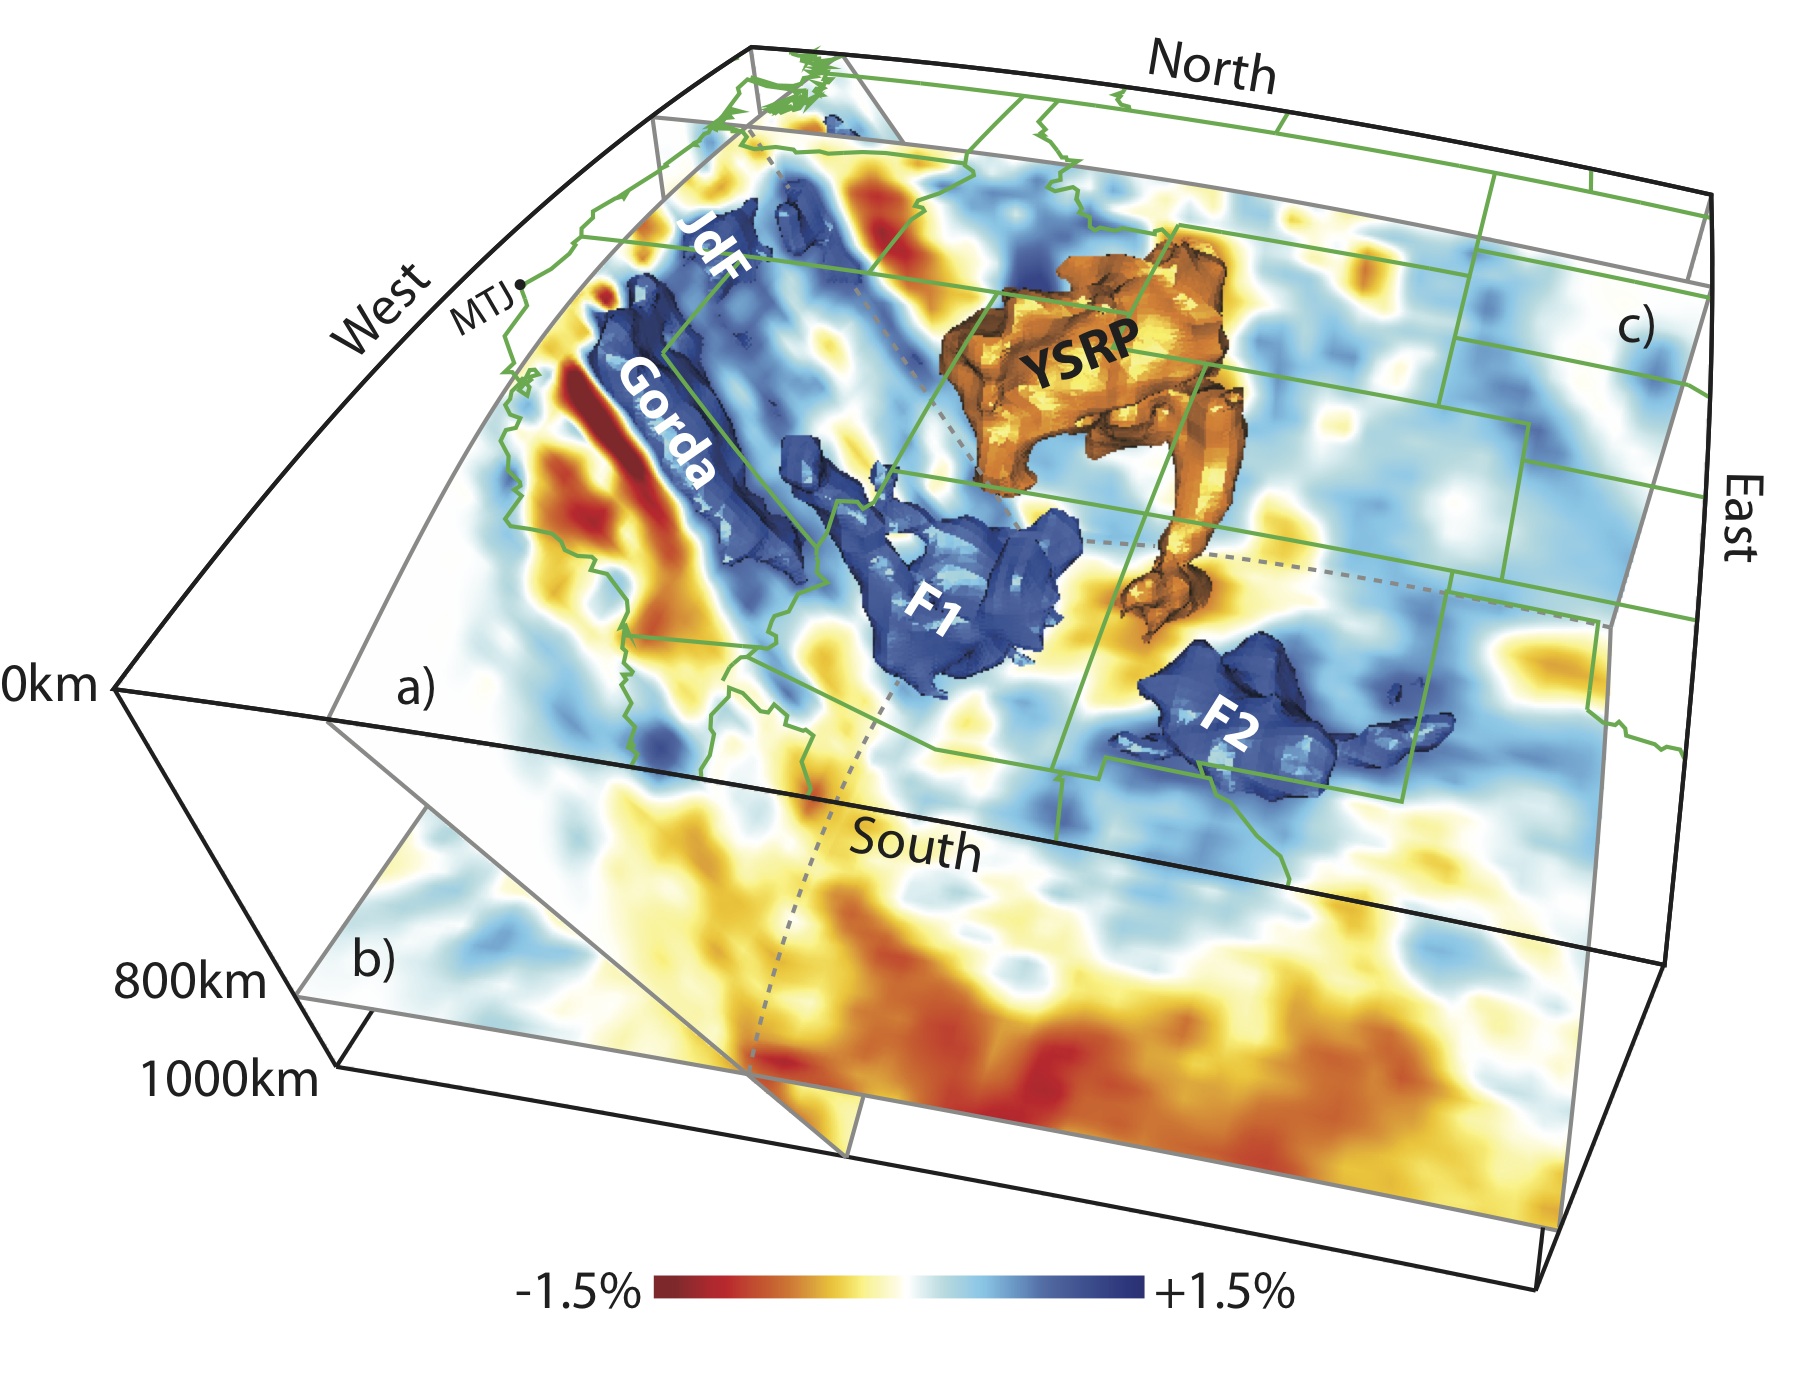
These are the first DNA models that use finite frequency sensitivity kernels and the region of good resolution extends from the Pacific coast to east of he Rocky Mountain Front. The P- and S-velocity models show a plume extending from the lower mantle to the surface beneath Yellowstone, and a shallow and fragmented Juan de Fuca slab. The complex geometry is interpreted as being due to interactions between the plume and slab and can explain the unusual characteristics of the Cascadia subduction system including the absence of deep earthquakes and trench-perpendicular orientation of seismic anisotropy.
DNA07-P&S:
P- and S-velocity models for the western US
Data downloads
Publication
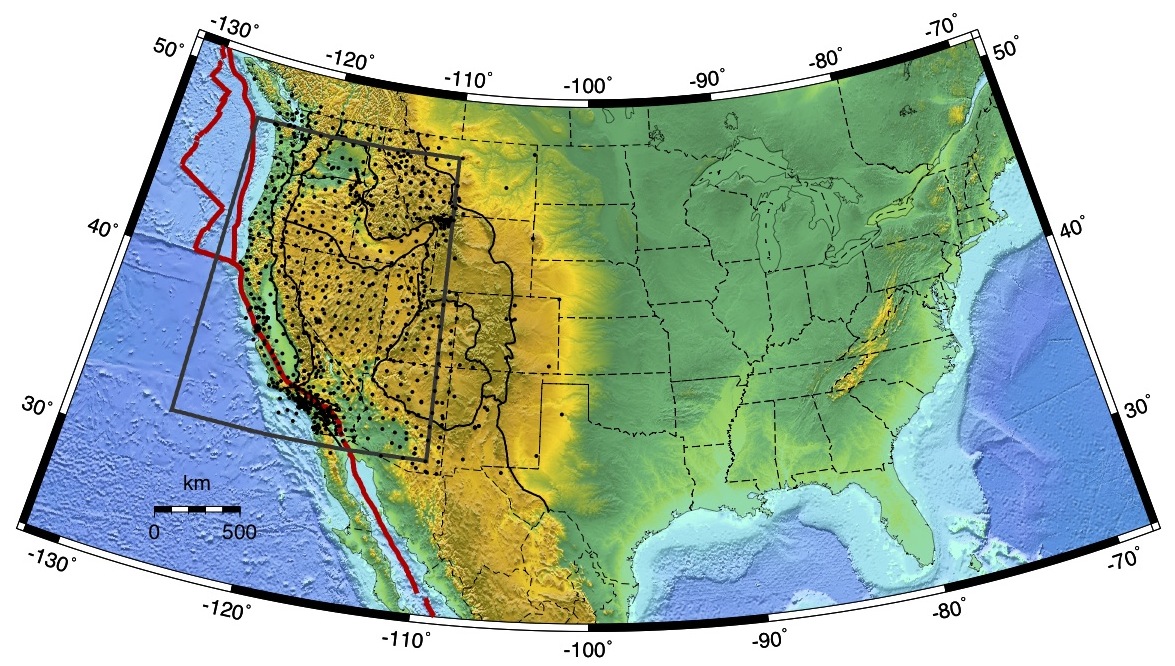
In these first models of the DNA series, the shallow depth extent of the Juan de Fuca subduction system is imaged with a low velocity "slab window" to the south of the Mendocino Triple Junction. Beneath Yellowstone, a low velocity conduit dips to the northeast. The model uses Earthscope data up to October 2007 and the coverage therefore extends from the Pacific coast to the mid-Rocky Mountains (~110 deg W).
